


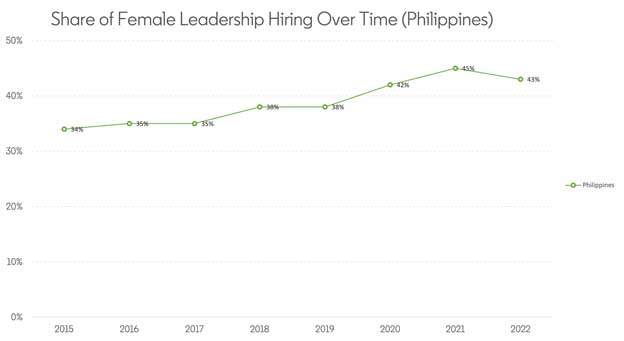
New LinkedIn data, published in the World Economic Forum’s 2022 Global Gender Gap Report, reveals that more women are being hired in leadership roles since 2015, with the largest increase seen in the Philippines among all Asia Pacific (APAC) markets studied, according to new LinkedIn data.
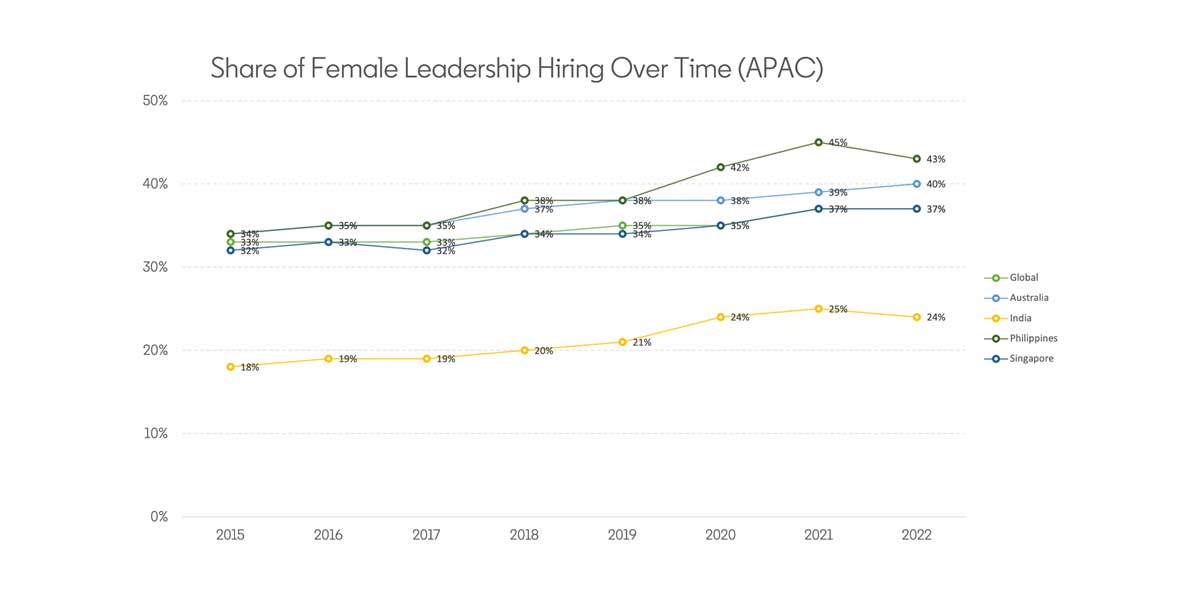
Only about 1 in 3 (34%) hires into leadership positions in the Philippines in 2015 were women, with that figure jumping to 43% in 2022. Of the countries considered, the second largest increase among APAC markets are from Australia and New Zealand (from 34% in 2015 to 40% in 2022) and India (from 18% in 2015 to 24% in 2022). Singapore saw a slightly smaller increase in the hiring of women into leadership roles from 32% in 2015 to 37% in 2022.
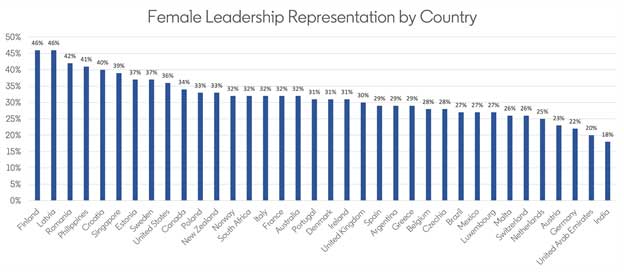
Out of the 36 major economies considered, the Philippines ranks 4th globally in the representation of women in leadership positions. LinkedIn data shows that women account for a third of leadership roles (31%) worldwide. Among the countries studied in the APAC region, the Philippines has the highest representation of women in leadership at 41%, followed by Singapore (39%), New Zealand (33%), Australia (32%) and India (18%).
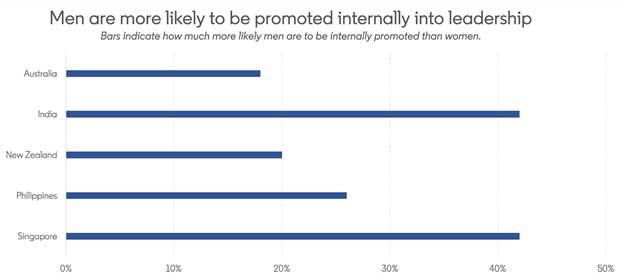
However, women are not getting promoted internally into leadership positions as frequently as men. In the Philippines, men are 26% more likely to be promoted into leadership positions than women. This statistic is more pronounced in other APAC countries like Singapore and India (42%).
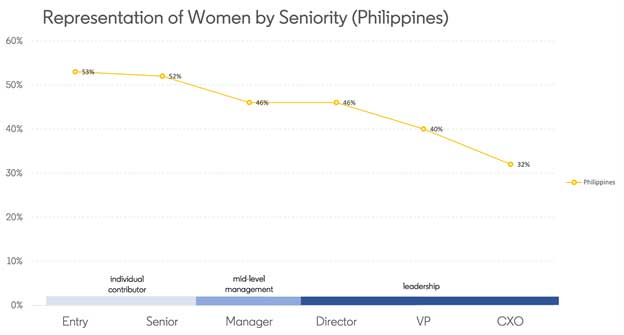
According to LinkedIn’s report, the proportion of women decreases as they rise through the career ranks. At a global average, there are only 27% of women at the Vice President (VP) level, and 25% at the C-Suite (CXO) level – two of the highest seniority levels in the workforce. In the Philippines, there are 40% at the VP level, and 32% at the CXO level, higher than the global average.
While there are more female leaders in industries where women are better represented in the workforce, their representation in leadership roles within these industries are not always necessarily higher than men. For example, in the Philippines, there are more women working in Education (62%) and only slightly more female leaders than male leaders (52%). In the Healthcare sector, there are more women (60%), but only 45% women are in leadership roles.
Feon Ang, Managing Director, APAC, LinkedIn said, “Our data is telling us a very clear story: Women face more barriers in the workplace when compared to their male counterparts – they are currently underrepresented in leadership, and are not being promoted into leadership roles at the same rate as men. We need to do more to ensure that women in the workforce have equal access to opportunities. Organisations and business leaders should look at solutions like internal mobility, fair hiring practices with a focus on skills and flexibility. This will ensure that women are equal contributors at all levels in an organisation.”
To support female entrepreneurs, and women in the workforce, LinkedIn will unlock these courses for free until 23 August 2022:
- Gender in Negotiation
- Getting to Yes: Advice for Female Founders on How to Get Funded
- Leadership Strategies for Women
- Success Strategies for Women in the Workplace
View more of LinkedIn’s gender insights here.
METHODOLOGY
This analysis represents the world seen through the lens of LinkedIn data, drawn from the anonymized and aggregated profile information of LinkedIn’s 830 million members around the world. As such, it is influenced by how members choose to use the platform, which can vary based on professional, social, and regional culture, as well as overall site availability and accessibility.
Gender identity isn’t binary and we recognize that some LinkedIn members identify beyond the traditional gender constructs of “men” and “women.” If not explicitly self-identified, we have inferred the gender of members included in this analysis either by the pronouns used on their LinkedIn profiles, or inferred on the basis of first name. Members whose gender could not be inferred as either man or women were excluded from this analysis.
The share of women in leadership represents the total number of women holding Director, VP, C-suite or Partner positions divided by the total number of men and women holding these positions. The internal promotion rate reflects the number of LinkedIn members who added a new leadership position at the same employer to their profile in 2021 divided by the total number of members holding entry, senior IC or manager-level positions during that year.
The LinkedIn Founding Rate measures the number of LinkedIn members who added a new founder position to their profile in a year, divided by the number of members in that country (and gender) during that year. We then index this to the rate in 2016 to show how this rate has changed for each gender.


