


Following two consecutive quarters of decline, the residential real estate prices of various types of new housing units in the Philippines recovered in Q3 2021 based on the year-on-year (YoY) growth of the Residential Real Estate Price Index (RREPI).
The nationwide house prices increased by 6.3 percent YoY (from -9.4 percent in Q2 2021) partly due to the stronger consumer demand for residential property, particularly townhouses and condominium units.
This is consistent with the outcome of the Q3 2021 Consumer Expectations Survey (CES), which showed a higher percentage of consumers preferring to buy real estate property in the reference quarter amid signs of economic recovery.[1]
Likewise, nationwide property prices increased by 0.7 percent quarter-on-quarter (QoQ) (Figure 1).
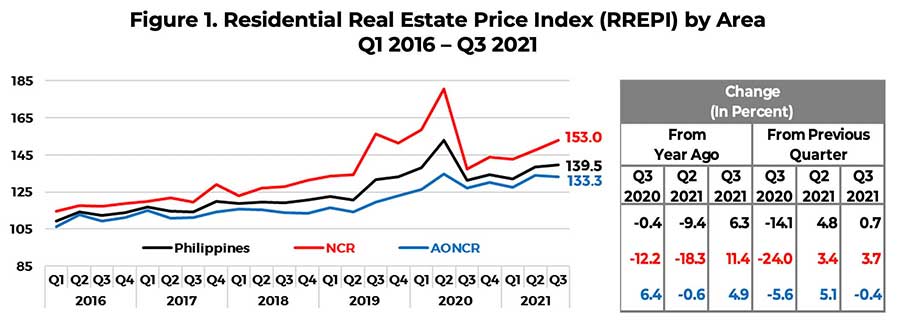
By area, residential property prices in the NCR and Areas Outside NCR (AONCR) expand YoY, but decline QoQ in the AONCR
After trending downwards for the past four consecutive quarters since Q3 2020, the nationwide residential property prices rose by 6.3 percent, driven mainly by the double-digit growth of 11.4 percent in the NCR (Figure 1).
The considerable uptick in the NCR residential property prices was brought about by the rise in the prices of townhouse and condominium units, which outweighed the decline in the prices of single detached/attached houses in the NCR. In the case of duplex housing units in the NCR, no bank loans were granted and reported to the BSP in Q3 2021.[2]
Similarly, property prices in the AONCR increased by 4.9 percent YoY as the growth in the prices of townhouses, duplex housing units, and condominium units more than offset the drop in the prices of single detached/attached houses. On a QoQ basis, residential property prices grew in the NCR (by 3.7%), following the national trend, but fell marginally in the AONCR (by 0.4%).
By type of housing units, YoY growth is mainly attributed to the rise in prices of townhouses and condominium units
The 6.3 percent YoY upturn in the nationwide RREPI in Q3 2021 was primarily driven by the rise in prices of townhouses and condominium units at 37.1 percent and 13.6 percent, respectively. Growth in prices of condominium units reverted into the positive territory after four consecutive quarters of decline, primarily due to the rebound in prices for the said units in the NCR. By contrast, prices of single detached/attached houses and duplex housing units contracted by 4.2 percent and 0.2 percent, respectively (Figure 2).
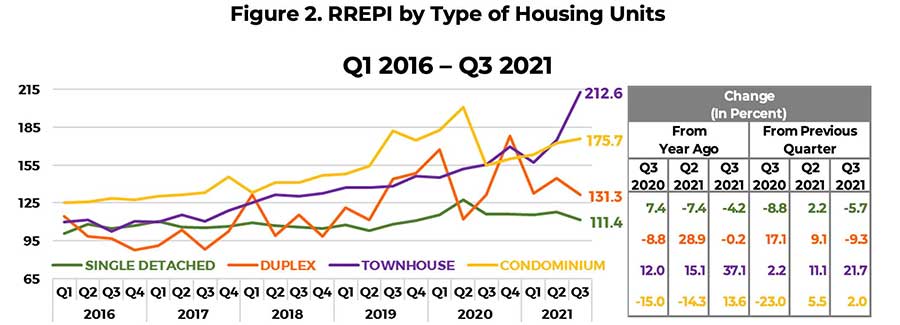
Similarly, the QoQ growth of 0.7 percent in the RREPI was attributed to the higher prices of townhouses and condominium units (Figure 2).
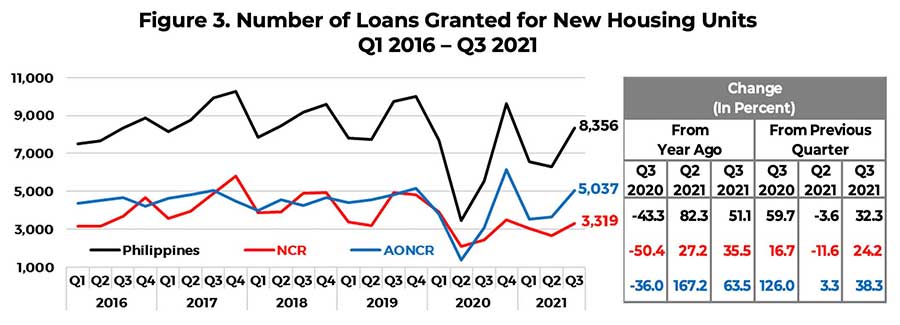
Residential real estate loans for new housing units increase YoY and QoQ
In Q3 2021, the number of RRELs granted for all types of new housing units in the Philippines expanded by 51.1 percent YoY and 32.3 percent QoQ. A similar trend was observed in the NCR and the AONCR (Figure 3).
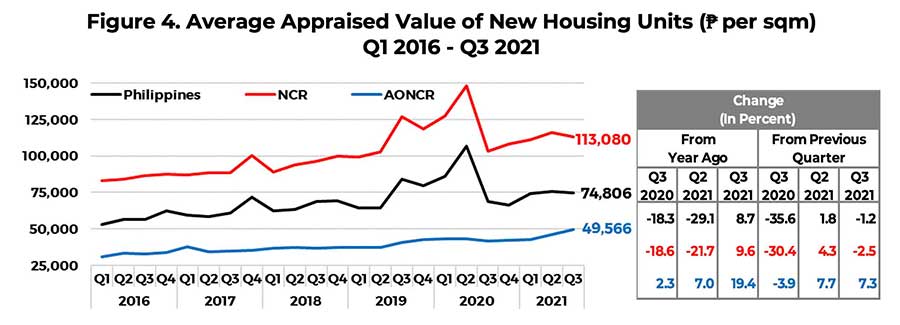
The average appraised value per sqm of new housing units in the country expanded by 8.7 percent YoY, but contracted by 1.2 percent QoQ. This trend was similarly observed in the NCR. Meanwhile, the average appraised value per sqm of new properties in the AONCR rose YoY and QoQ (Figure 4). All types of new dwellings registered higher average appraised value per sqm YoY, except for single detached/attached houses. On a QoQ basis, townhouses and condominium units recorded higher average appraised value per sqm YoY, while lower average appraised value per sqm were observed for duplex housing units and single detached/attached houses.
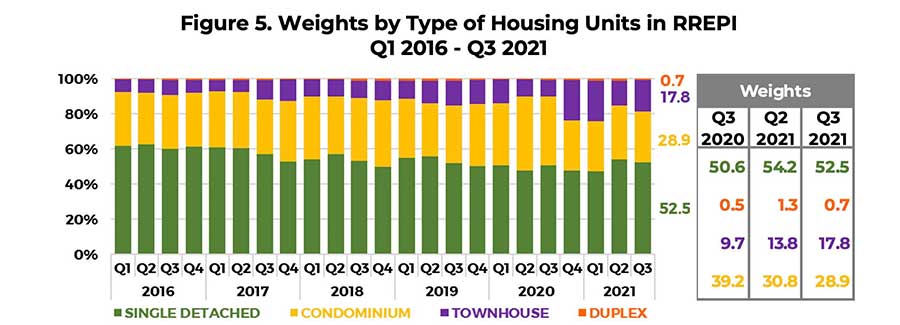
The weight of each type of housing unit in the RREPI is determined by dividing the total floor area (in sqm) of a specific type of housing unit over the total floor area of all housing types. Hence, in Q3 2021, single detached/attached houses in the RREPI continued to constitute the largest weight at 52.5 percent. Meanwhile, condominium units, townhouses, and duplex housing units accounted for 28.9 percent, 17.8 percent, and 0.7 percent, respectively (Figure 5).
Profile of residential real estate loans in Q3 2021
In Q3 2021, the purchase of new housing units accounted for 84.7 percent of residential real estate loans (RRELs).[3] Meanwhile, by type of housing unit, most of the residential property loans were used for the acquisition of single detached/attached houses (43 percent), followed by condominium units (39.2 percent) and townhouses (17.1 percent) as seen in Figure 6.
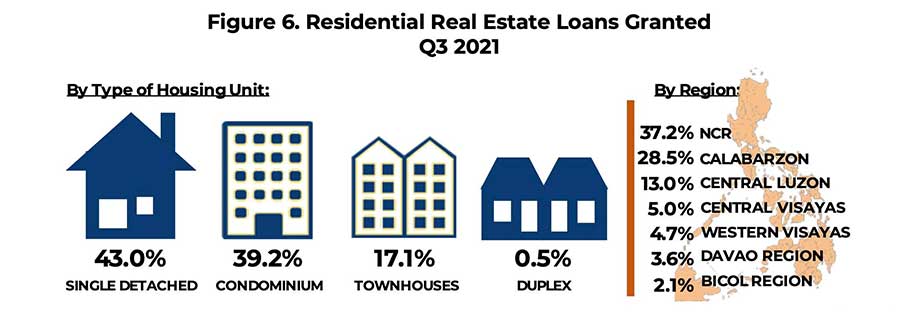
Most of the RRELs granted in NCR were for the purchase of condominium units, while RRELs granted in AONCR were for the purchase of single detached/attached houses. By region, 37.2 percent of the total number of RRELs granted were from the NCR, while the rest were distributed in AONCR―CALABARZON (28.5 percent), Central Luzon (13 percent), Central Visayas (5 percent), Western Visayas (4.7 percent), Davao Region (3.6 percent), and Bicol Region (2.1 percent). NCR and the said six regions combined accounted for 94.1 percent of total housing loans granted by banks (Figure 6).
The RREPI is a measure of the average change in the prices of various types of housing units, i.e., single detached/attached houses, duplex housing units, townhouses, and condominium units, based on banks’ data on actual mortgage loans granted to acquire new housing units only. It is a chain-linked index, which is computed using the average appraised value per square meter, weighted by the share of floor area of each type of housing unit to the total floor area of all housing units. The RREPI is used as an indicator for assessing the real estate and credit market conditions in the country. The BSP has been releasing the report since Q1 2016.
Data for the RREPI are obtained through BSP Circular No. 892 dated 16 November 2015, which requires all universal/ commercial banks (UBs/KBs) and thrift banks (TBs) in the Philippines to submit to the BSP a quarterly report on all RRELs granted.
[1] The Q3 2021 CES results showed that the percentage of Filipino households, who considered Q3 2021 as a favorable time to buy a house and lot, grew by around 16 percent YoY, from 14.4 percent in Q3 2020, to 16.7 percent in Q3 2021.
[2] The RREPI is constructed using bank data on actual mortgage loans that are granted within a given period and reported to the BSP. As such, if no loans were granted and reported for a certain type of residential property within the reference period, the price relative will be undefined. Thus, the index level and price change of the pertinent residential property type for the current quarter will be the same as the previous quarter’s index level and price change.
[3] The remaining portions of the RRELs were for pre-owned (14.5 percent) and foreclosed (0.8 percent) residential housing properties.


