


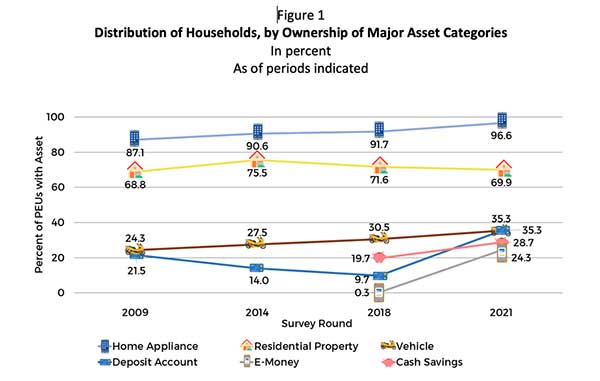
Non-financial assets remained the foundation of Filipino household wealth. Home appliances and equipment were the most commonly owned assets (96.6%), followed by residential properties (69.9%) and vehicles (35.3%).
Among vehicles, motorcycles accounted for the majority (61.7%). A shift in homeownership trends emerged, with more families opting for rental accommodations (11.3%) compared to the previous survey (10.2%).
In the appliance category, mobile phones (92.8%) continued to surpass televisions (81.1%) as the most common household item, reflecting the increasing importance of digital connectivity, especially during crises.
The composition of financial assets revealed key trends in consumer behavior. Deposit accounts had the highest ownership rate (35.3%), followed by traditional cash savings kept at home (28.7%) and the rapidly growing category of e-money accounts (24.3%).
The post-pandemic recovery drove growth in financial assets, particularly in formal banking and digital financial products. Financial institutions played a crucial role in this transition by accelerating the development of user-friendly digital services, catering to consumers’ need for remote financial access during lockdowns.
Liability Trends and Saving Behaviors
The pandemic significantly reshaped Filipino households’ approach to debt and savings. Facing economic uncertainty, households increased precautionary savings to safeguard against job losses and declining incomes.
Government-imposed restrictions on movement and business operations limited traditional spending on travel, dining, and entertainment. However, these restrictions unintentionally boosted savings, providing financial relief during the crisis. Households also benefited from government financial assistance programs.
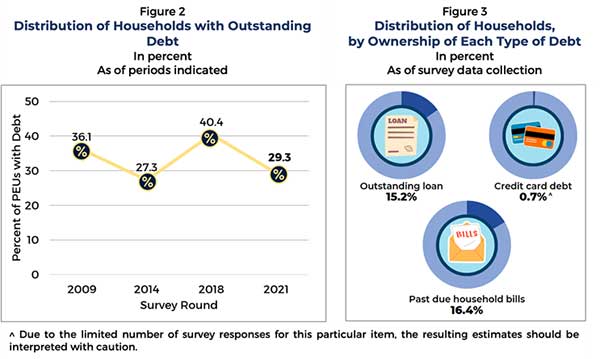
During this period, households were more cautious about taking on additional debt, leading to a sharp decline in overall borrowing. The survey showed that only 29.3% of households carried any form of debt, down from 40.4% in the 2018 survey.
The majority of household liabilities consisted of unpaid bills (16.4%) and outstanding loans (15.2%). Only 0.7% of households had credit card debt, mostly for purchasing basic goods.
Household Income
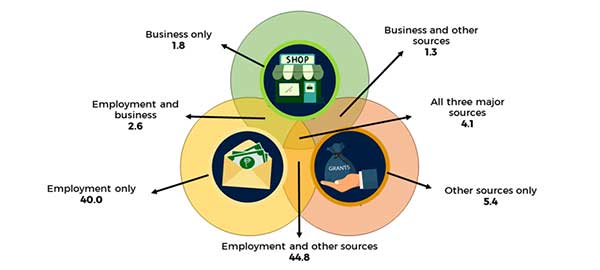
Wages remained the leading source of income among households in 2021. The percentage of households receiving wage income rose to 91.5 percent, up from 73.7 percent in 2018. Government employment initiatives implemented to counteract pandemic-related job losses largely drove this increase. About 9.8 percent of households received income from businesses, primarily sole proprietorships in retail or food service, while 55.6 percent relied on other sources, mainly government pandemic assistance or ayuda. These ayuda, which included cash subsidies and food packs. played a crucial role during the COVID-19 pandemic, providing essential financial support to many households facing economic hardships due to lockdowns and job losses.
Figure 4
Distribution of Households Relying on Major Income Sources
In percent
2021
Household Spending
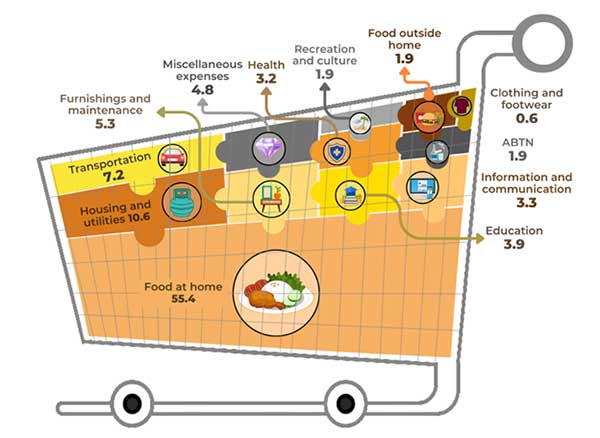
Spending patterns of households in 2021 revealed that food and beverages consumed at home accounted for the largest expenditure share at 55.4 percent, consistent with findings from previous survey rounds. For non-food items, housing and utilities accounted for 10.6 percent, while transportation took up 7.2 percent of the budget. This spending distribution underscores the importance of government price management for essential goods and services.
Meanwhile, non-essential items, including miscellaneous expenses, alcoholic beverages, tobacco, narcotics, and recreation and culture, made up 8.6 percent of total expenditure, with miscellaneous expenses such as personal care, celebrations, and gifts having the highest share at 4.8 percent.
Figure 5
Average Share to Total Expenditure of Households, by Expenditure Item
In percent
2021
Household Profile
The country’s relatively young and healthy population presents potential for a demographic dividend. The average household consisted of four members, with about half of the members under 28 years of age, and an almost equal distribution of males and females. Furthermore, about 37.1 percent of household members aged 3 years and over were currently studying, while 49.8 percent of those not attending school were at least high school graduates. Most household members (92 percent) reported good self-assessed health status. To capitalize on this demographic advantage, investing in high-quality education and robust health services is crucial to ensure a well-educated, healthy, and productive young workforce that can drive higher economic growth.
About the Survey
The Consumer Finance Survey (CFS) is a nationwide survey of the Bangko Sentral ng Pilipinas (BSP) on the financial condition of Filipino households, considering their assets, liabilities, income, and expenditure. Patterned after the United States’ Survey of Consumer Finances (SCF) of the Federal Reserve Board, the CFS was developed in 2008 to address data gaps on household wealth and indebtedness in the Philippines. It complements the existing household surveys of the Philippine Statistics Authority (PSA), namely the Family Income and Expenditure Survey (FIES) and the Annual Poverty Indicators Survey (APIS). Data for the 2021 CFS were gathered from 16,212 respondent households (90.1 percent of the targeted 18,000 sample households) nationwide from 31 March 2022 to 11 December 2022. Employment, income, and expenditure data were for the calendar year 2021, while all other information, such as the household profile, assets, and liabilities, was as of date of interview.
[1] The term “household” can be interchangeably used with “primary economic unit (PEU)” as almost all (98.9 percent) household members were part of the PEU, making the composition of a PEU similar to that of a household. The PEU consists of household members who are financially interdependent on each other as they either contribute to or rely on the household finances for their living expenses.


