


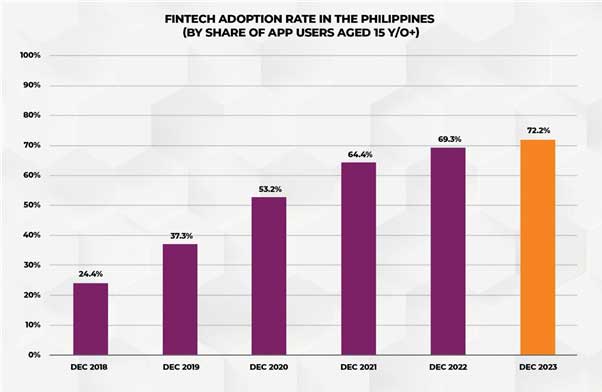
Digido has revealed that, among the adult population in the Philippines, the adoption rate of fintech services has almost tripled over the past five years, to 69.3% in 2022. The current year is forecasted to yield another +2.9 p.p. The analysis was based on data on the population of the region aged 15+ and on the fintech mobile apps used by them.
METHODOLOGY
The following sectors were identified as the main categories of fintech for the classification of mobile applications:
- Digital Lending (includes applications of P2P lending, microcredit, POS financing, crowdlending, crowdfunding and online loans)
- Blockchain and Cryptocurrency (includes cryptocurrency exchange platform applications, blockchain platforms for smart contracts and asset tokenization, decentralized exchanges and cryptocurrency mining applications)
- Business Management (includes cybersecurity applications — authenticators, process management within the company, including accounting and finance, project management, resource management, customer relationship management (CRM), inventory and warehouse management and business process analytics)
- Digital Banking (includes mobile banking applications from traditional banks and fully certified digital banks)
- Digital Insurance (includes applications for registration and management of insurance policies, automatic recognition and assessment of losses using artificial intelligence, monitoring the state of the insurance portfolio and providing personalized offers for customers, telematics and risk assessment)
- Digital Assets and Investments (includes applications for accessing financial markets in order to invest in any financial assets)
- E-Commerce (including B2B, B2C and C2C interaction format applications)
- Electronic wallets (i.e. apps that electronically store a monetary value in an instrument or device)
- Financial Advisors and utilities (includes applications for improving financial literacy, calculating cross-currency rates, financial news, trading robots and signals, investment recommendations and trading indicators)
10.HR Department and Payroll (applications for hiring employees and their salary management)
11.Payments and Transfers (includes single applications for paying bills, services, taxes, transfers inside and abroad, ATM, chatbots for payment, QR payments, Internet payments, instant payments and remittances)
12.Wealth Management (includes applications for personal money management, budget analysis, expenses, income, debt management and pension provision)
Note in advance that due to the possibility of having at least one application from one fintech sector for one user, it is impossible to use simple summation when aggregating statistics on applications — then we will only get the number of accounts. In this case, we will resort to calculating the real number of users by summing the statistics of the number of active users of the leader in a particular industry (as the minimum estimated boundary) and the average weighted by the number of active users in other applications of the same sector.
Data about mobile apps was collected from the service data.ai in a monthly presentation from 2018 to 2022. The target indicator was the number of active users at the end of each month. An active user means someone who has logged into the application at least 1 time in the last 30 days.
App distribution according to fintech sectors
The popularity and importance of mobile applications is growing every year. Thus, according to Data Reportal, smartphone penetration among the total population in 2022 reached 71.7% (63.4% in 2021), while Internet penetration – 73.1% (65.9%). These figures are average for the SEA region, but above the global average. This is telling of the growing access of the population to mobile applications, including fintech.
First, a study of mobile fintech app activity in the Philippines. Out of 2,442 apps registered in SEA (per data.ai), 35.5% or 867 are actively[1] used in the country. The following graph shows the distribution of these mobile applications by the fintech sector at the end of 2022.
[1] The applications with active users, i.e. those who logged into the application at least once in the last 30 days.

In the Philippines, Blockchain & Cryptocurrencies (47.4% of SEA’s Blockchain & Cryptocurrencies) and Digital Banking (42%) apps are the most widespread. On the other hand, Payments & Transfers (26.6%) and Digital Insurance (26.4%) are the least used.
This spread looks about the same if we consider them in isolation from the rest of SEA, focusing just on the country itself (see the diagram below).

The Digital Banking and E-Wallets sectors are the most popular — 163 applications (18.8% of the total number of used fintech applications in the country) — 134 (15.5%), respectively. In turn, the Digital Insurance and HR & Payroll sectors hold the smallest share – 14 applications each (1.6% each). It is important to note that the Digital Banking sector and E-Wallets are both quite popular in the Philippines. The people of the country seek safe and convenient ways to manage their personal finances.
Evaluating the downloads of mobile fintech apps
Now, having considered the number of apps used monthly, it is time to look at their download statistics – from the Google Play Store and the iOS AppStore in the Philippines for as of 2022.

As of 2022, the total cumulative downloads of such apps reached 401.9 million, comprising 11.3% of the same indicator, but for the entire SEA region. In terms of the number of downloads, the Philippines is gradually developing a competitive industry, according to the special Herfindahl-Hirschman Index (HHI). At the end of 2022, this indicator continued its gradual decline to 2878 points (vs. 3185 in 2021 and 5192 in 2018). The higher the value of this index from 0 to 10,000, the less competitive (monopolistic) the market is and the more it is concentrated in the hands of few individual sectors (or players).

The highest download growth rate is observed in the Payments & Transfers sector 11.3% per month. The lowest – in the Digital Insurance sector, with only 0.7%. It’s fairly obvious that this is related to the current volume of downloads in general. It is difficult for large sectors to maintain high download growth rates, because their capabilities are limited from above. Firstly, by the population, and secondly, by the infrastructural capabilities of the planet to provide each person with more than 1 mobile Internet connection here and now.
Taking everything into consideration, the mobile fintech market in the Philippines is becoming increasingly competitive. The players in this market have less and less ability to solely control consumer behavior. It also means that, in order to attract and retain their customers, fintech players will have to focus more on the quality of their products and services, innovation and improving the customer experience. Overall, this is a positive development for consumers, as competition usually results in higher quality products and services, lower prices, and more choice.
Evaluating the number of fintech users
Moving on to estimating the number of fintech mobile app users in the Philippines in 2022. The results of the calculations are presented in the table below.

Calculating this parameter stemmed from the idea that each person can use two or more applications of the same type. In this case it is considered as an account that can be accounted for in several different applications at the same time. The same logic applies to sectors, based on the fact that a person can use simultaneously, for example, banking apps, e-wallets and digital investments. Then, relative to the sectors, it is an account, of which there may be several. In a sense, such an assessment can be called a “weighted average level of fintech account-ing”.

According to Digido estimates, the level of adoption of fintech services among the population aged 15+[1] in the Philippines reached 69.3% in 2022 vs. 64.4% a year earlier. Similar to the region as a whole, the largest contributor is the e-commerce sector, with penetration among adults close to 100% in the Philippines at the end of 2022.
Statista claims that the e-commerce market in the Philippines reached $16 billion in 2022, growing by 124% over the past 5 years (CAGR (2018 – 2022) = 17.48%). According to the US International Trade Administration, in 2021 the number of e-commerce users reached 73 million (vs. 73.2 million according to our data). Moreover, the expected growth rate of this market sector in the Philippines remains decent – CAGR (2023 – 2027) of 12.93%. Notably, Philippine e-Commerce is roughly the size of that in Vietnam.
Such high market growth rates were ensured by three important factors: government involvement, prospects for the introduction of fintech technologies among the population, and, of course, the pandemic. For example, in 2016, the “Philippine ECommerce Roadmap 2016-2020” program was launched, which is aimed at developing the infrastructure for national e-commerce. Its successor was the next 2022 roadmap “E-Commerce Philippines Roadmap 2022”. It contains 20 strategies and 22 goals for the development of e-commerce for the next 5 years and indicates the future strengthening of digital payments. In addition, the legal aspect of this market is also currently in the keen attention of the government. According to the Philippine Department of Commerce, there are about 16 different major regulatory laws, acts, and rules in place in the country responsible for the smooth functioning of e-commerce.
In addition to government support, the Philippine domestic market itself is very promising for the implementation of various fintech technologies. Specifically – the degree of digitalization of the region and the familiarity of its citizens with financial technologies. For example, one of the most important parts of the digital infrastructure is the population’s access to the Internet and mobile communications. At the end of 2022, there were about 30,000 combined communication towers in the Philippines. However, about 70,000 pieces are required to completely cover the country with a stable effect of such towers. In turn, the number of Internet users in the country in 2022 reached 85.2 million people (73.7% of the total population according to UN estimates), vs. 76 million (66.7%) a year prior. In addition to all this, the Covid-19 pandemic in 2020-2021 also provoked an explosive growth in demand for financial technologies in the country, literally “forcing” the population to use such digital technologies.
Speaking of e-commerce, digital payments are quite an essential basis for this market. They can take on many forms, from simple bank transfers to advanced and instant QR payments. For example, according to our estimates, there are now four times more e-wallet users in the Philippines than mobile banking users. In fact, it doesn’t really matter how the payment is made, because all this is the basis for the digital payment infrastructure in the country. According to the BSP data, the size and number of digital payments and transactions through the PhilPaSS system is constantly increasing, as is the demand for them.
E-wallets are currently the main driver of payment digitalization in the Philippines. For its part, BSP has introduced several initiatives to encourage SMEs to adopt digital payments and financial services. For example, the QR-Ph system; QR P2M, which allows payments from a person to a merchant; and the Paleng-QR Ph Plus system, which processes payments to market sellers, bike and car drivers, is now available from a mobile phone and a range of e-wallets. In addition, the roadmap for digital payments transformation is still in place, with the main goals of achieving a level of 50% digital payments in total retail payments and increasing the connection of adult Filipinos to fintech by up to 70%.
Thus, our assessment of the fintech adoption rate among adults in the Philippines appears to be relevant. The Philippine fintech infrastructure shows high adaptability to ever-emerging challenges, both through strong government support and a large domestic market.
What to expect in 2023
Now, based on fintech users data over the past 5 years, we will be able to estimate[2]the distribution of users at the end of 2023.
[2] Using a second-order Bayesian VAR approach with a Litterman-Minnesota prior (number of samples at each prediction step = 100,000), which includes as endogenous parameters the trend values of the estimated number of users by sector (defined by the Hodrick-Prescott filter with lambda 4176) , and as exogenous parameters – the population of the Philippines according to UN estimates, the size of GDP from the World Bank, the estimate of the number of Internet users from DataReportal, and the amount of funds raised in Fintech through funding rounds according to Tracxn.

By the end of 2023, the FinTech adoption rate in the Philippines among the population aged 15+ may increase to 72.2% or 59.3 million users. The maximum growth of this indicator is expected in the Payments & Transfers sector (+17.6%), while the smallest (negative, even) is in Blockchain & Cryptocurrencies (-4.3%).
We believe that the payments sector will be the main driver of the future adoption of fintech. It could equally be any of the following: electronic wallets, digital banking and applications that are not related to either the first or the second (payment of bills, taxes, etc.). As long as the country holds the course towards digitalization, inertial movements towards the “fintechization” of the population will not weaken.
Thus, according to our estimates, the main contribution to the development of the fintech industry in the Philippines is made by 3 industries: E-Wallets (+1026% user growth over the past 5 years), Digital Lending (+330%) and E-commerce (+222%). However, in turn, digital lending shows more stable annual growth rates than all other fintech sectors in the Philippines.
In summary, total financial inclusion in the Philippines is only a matter of time.


