


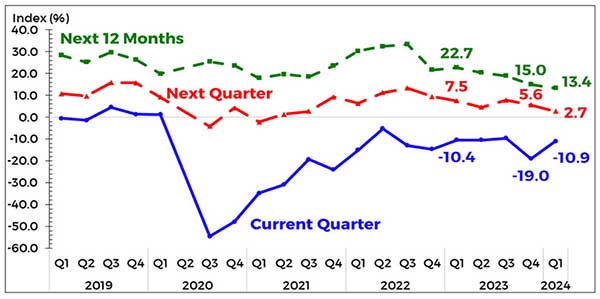
The consumer sentiment in the Philippines improved in Q1 2024 as the overall confidence index (CI) became less negative at -10.9 percent from -19 percent in Q4 2023.
This improvement means that although the pessimists continued to outnumber the optimists, the number of pessimists declined compared to the Q4 2023 survey results.
According to the respondents, their improved outlook in Q1 2024 was brought about by their expectations of: (a) additional and higher income, (b) availability of more jobs and permanent employment, and (c) additional working family members.
Meanwhile, consumer sentiment was less optimistic for Q2 2024 and the next 12 months (February 2024 – January 2025) as the CIs declined to 2.7 percent and 13.4 percent from 5.6 percent and 15 percent, respectively, in the Q4 2023 survey round.
The weaker outlook of consumers for both periods was attributed to their anticipation of: (a) faster increase in the prices of goods, (b) fewer available jobs, and (c) lower income.
Consumer confidence across the three component indicators is less favorable for Q2 2024. Consumers were less pessimistic with respect to the country’s economic condition and the family’s financial situation in Q1 2024 while their pessimistic outlook for family income was little changed. For Q2 2024 and the next 12 months, consumer outlook was less favorable across all three component indicators.
Outlook across income groups is also less favorable for Q2 2024. Consumer confidence in Q1 2024 was less pessimistic across all income groups, i.e., low-, middle-, and high-income groups. For Q2 2024, consumer sentiment was less upbeat among the middle- and high-income groups, while sentiment in the low-income group turned pessimistic compared with the Q4 2023 survey results. For the next 12 months, sentiment was less buoyant for the low-income group and remained optimistic among the middle- and high-income groups.
Consumers are less hesitant about buying big-ticket items in Q1 2024 and the next 12 months. The consumer sentiment on buying big-ticket items in Q1 2024 was less pessimistic as the CI became less negative at -62.6 percent from -71.3 percent in Q4 2023. Similarly, the buying sentiment on big-ticket items for the next 12 months was less pessimistic as the CI became less negative at -69.8 percent from -70.9 percent in Q4 2023.
The percentage of households with loans and savings increases in Q1 2024. The Q1 2024 survey results showed that 24.9 percent of households availed of a loan in the last 12 months, higher than the 22.9 percent recorded in Q4 2023. Further, the percentage of households with savings increased to 33.5 percent in Q1 2024 (from 29.1 percent in Q4 2023).
Consumers expect higher interest, inflation and unemployment rates, and a weaker peso in Q1 and Q2 2024. Consumers anticipate that the interest rate may increase, and the peso may depreciate against the U.S. dollar for Q1 2024, Q2 2024, and the next 12 months. Meanwhile, households expect that the unemployment rate may rise albeit at a slower pace in Q1 2024 and Q2 2024 but may decline in the next 12 months. Households also expect that the inflation rate may rise for all reference periods. Specifically, consumers are expecting that the inflation rate may average at 5.3 percent for the next 12 months, which is above the upper end of the National Government’s inflation target range of 2 to 4 percent for 2024-2025.
View report here: https://www.bsp.gov.ph/Lists/Consumer%20Expectation%20Report/Attachments/23/CES_1qtr2024.pdf
*The Q1 2024 CES was conducted during the period 19-31 January 2024. In the Q1 2024 CES, 5,340 households were identified as eligible households – 2,646 (49.6 percent) were from the NCR and 2,694 (50.4 percent) from AONCR. Of the said sample size, 5,207 households participated in the survey, equivalent to a response rate of 97.5 percent (from 97.4 percent in the Q4 2023 survey). Respondents comprised 2,577 households in the NCR (with a 97.4 percent response rate) and 2,630 households in AONCR (with a 97.6 percent response rate). The high-income group comprised the largest percentage of respondents (38.1 percent), followed by the middle-income group (38 percent) and the low-income group (23.8 percent)


