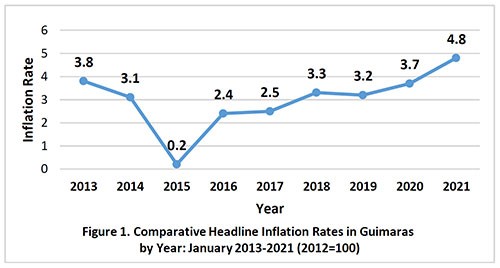
Guimaras’ year-on-year inflation rate hit 4.8% in January 2021, the fastest since 2013, based on the result of the Survey on Retail Prices of Commodities generated by the Philippine Statistics Authority (PSA).
January inflation in Guimaras for eight consecutive years (2013-2021) erratically moved. From 3.8% in January 2013, it constantly slowed to 0.2% in 2015, before jumping to 2.4% in 2016.
It then consistently inched up again in three years (2016-2018) to 2.4, 2.5 and 3.3%, respectively before decelerating again to 3.2% in 2019.
An uptrend was once again noticed in the next two years and peaked at 4.8% in 2021.
Provincial Statistics Officer (PSO) Nelida B. Losare of PSA-Guimaras explained that the 2021 inflation, which recorded an increment of 1.1%age points from its previous year’s rate of 3.7%, was due to the price spikes in the heavily weighted alcoholic and non-food commodities which diluted the 0.3% drop each in food and non-alcoholic beverages.
Results of the Retail Prices Survey of the PSA generated a consumer Price Index (CPI) of 126.8 for the month of January 2021, up from 121.0 in January 2020. This means that an average Guimarasnon household needs PHP26.8 more in January 2021 to buy a basket of goods worth PHP100 in 2012.
Based on the data generated from the retail prices survey, the following heavily-weighted non-food commodities showed upticks:
-Housing, Water, Electricity, Gas and other Fuels (6.1%);
-Transport (16.8%);
-Restaurant and Miscellaneous Goods and Services (6.6%);
-clothing and footwear (5.3%) and;
-Health (2.5%).
The 6.1% swell in Housing, Water, Electricity, Gas and other Fuels was due to price increments in Electricity, Gas and Other Fuels (8.1%); and Actual Rentals for Housing (5.6%).
The 66.2% price hike in transportation services fueled the 16.8% inflation rise in the Transport Commodity group in January 2021.
High prices of Catering Services (7.6%); and Personal Effects N.E.C (6.5%) also pushed the inflation rate of Restaurant and Miscellaneous Goods and Services.
Faster inflation in Health Commodity was mainly driven by the high charges on Out-patient Services (6.8%).
Other non-food commodities which showed faster inflation were: Alcoholic Beverages and Tobacco (6.8); Clothing and Footwear (5.3); Furnishings, Household Equipment and Routine Maintenance of the House (5.9); and Education (5.1).
Losare also said that only two commodity groups – Food and Non-Alcoholic Beverages, and Recreation and Culture – decrease by 0.3% each while Communication price remained at 99.9.
On the commodity of Food and Non-Alcoholic Beverages, only food items showed a plodding price movement specifically Sugar, Jam, Honey, Chocolate and Confectionery (-0.9); Rice (-9.0) and; Bread and Cereals (-6.2).
Inflation quickened in six other sub commodities: Oils and Fats (13.6), vegetables (8.5), Milk, Cheese and Eggs (4.3), fruits (2.8), meat (2.5), and fish (1.2).
“On Recreation and Culture commodity, dwindling prices were noticed on Recreational and Cultural Services; and Newspapers, Books and Stationery, with a drop of 15.4 and 0.5%, respectively,” Losare said.


