


The residential real estate prices of various types of new housing units in the Philippines declined for two consecutive quarters, based on the year-on-year (YoY) growth of the Residential Real Estate Price Index (RREPI).
In Q2 2021, the nationwide house prices contracted by 9.4 percent YoY (from -4.2 percent in Q1 2021) due to the continued effects of the pandemic on the residential property demand. High base effects may also have contributed to the drop in prices given the registered peak of the index in Q2 2020.[1] In contrast, property prices increased by 4.8 percent quarter-on-quarter (QoQ) (Figure 1).[2]

By area, NCR residential property prices slump YoY, but NCR and AONCR rise QoQ
The YoY contraction in the nationwide residential property prices was driven mainly by the downtrend of property prices in the NCR, which fell by 18.3 percent relative to Q2 2020, marking four consecutive quarters of decline since Q3 2020 (Figure 1). The decline emanated from the negative price changes of single detached, condominium and townhouse units in the NCR. In the case of duplex housing, no bank loans were granted and reported to the BSP in Q2 2021.[3]
Likewise, property prices in AONCR decreased marginally by 0.6 percent YoY as the drop in the prices of single detached/attached houses more than offset the growth in the prices of townhouses, duplexes, and condominium units. On a QoQ basis, house prices grew in NCR (by 3.4%) and AONCR (by 5.1%), following the national trend.
By type of housing units, YoY drop is largely driven by the fall in prices of condominium units and single detached houses
The 9.4 percent YoY drop in the nationwide RREPI was primarily driven by the fall in prices of condominium units and single detached/attached houses, at 14.3 percent and 7.4 percent, respectively, in Q2 2021. This is the fourth consecutive quarter that prices of condominium units declined, owing mainly to the lackluster demand for condominium units in NCR. In contrast, prices of duplexes and townhouses increased by 28.9 percent and 15.1 percent, respectively (Figure 2).

Meanwhile, the QoQ growth of 4.8 percent in the RREPI was attributed to the higher prices of all types of housing units (Figure 2).
Residential real estate loans for new housing units increase YoY, but decline QoQ
In Q2 2021, the number of RRELs granted for all types of new housing units in the Philippines rose by 82.3 percent YoY, but fell by 3.6 percent QoQ. A similar trend was observed in NCR, while the number of RRELs granted in AONCR expanded YoY and QoQ (Figure 3).

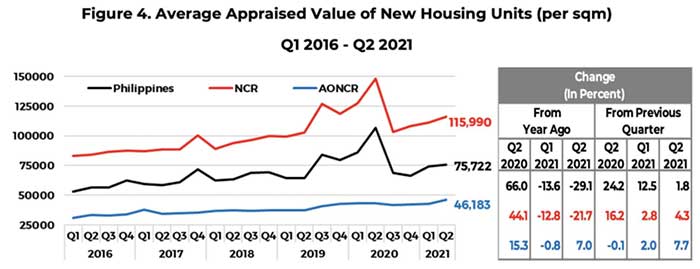
The average appraised value per sqm of new housing units in the country contracted by 29.1 percent YoY, but grew by 1.8 percent QoQ. This trend was similarly observed in NCR, while in AONCR, the average appraised value per sqm of new properties rose YoY and QoQ (Figure 4). By type of new dwellings, condominium units and single detached/attached houses registered lower average appraised value per sqm YoY, while higher average appraised value per sqm were observed for townhouses and duplexes. On a QoQ basis, average appraised value per sqm across all types of housing units increased.
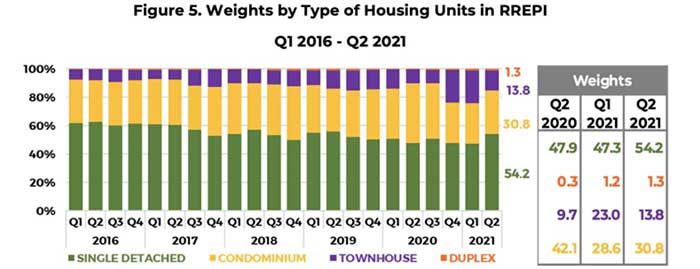
The weight of each type of housing unit in the RREPI is determined by dividing the total floor area (in sqm) of a specific type of housing unit over the total floor area of all housing types. Hence, in Q2 2021, single detached/attached houses in the RREPI continued to constitute the largest weight at 54.2 percent. Meanwhile, condominium units, townhouses, and duplexes accounted for 30.8 percent, 13.8 percent and 1.3 percent, respectively (Figure 5).
Profile of residential real estate loans in Q2 2021
In Q2 2021, the purchase of new housing units accounted for 79.1 percent of residential real estate loans (RRELs). Meanwhile, by type of housing unit, most of the residential property loans were used for the acquisition of condominium units (49.5 percent), followed by single detached/attached houses (39.2 percent) and townhouses (10.3 percent) as seen in Figure 6.
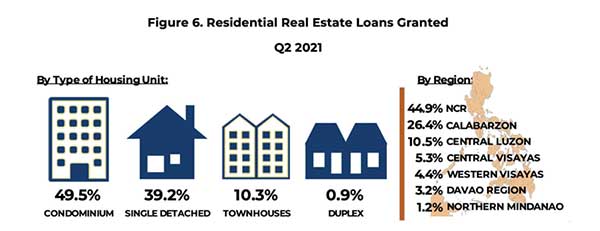
Most of the RRELs granted in NCR were for the purchase of condominium units, while RRELs granted in AONCR were for the purchase of single detached/attached houses. By region, 44.9 percent of the total number of RRELs granted were from the NCR, while the rest were distributed in AONCR―CALABARZON (26.4 percent), Central Luzon (10.5 percent), Central Visayas (5.3 percent), Western Visayas (4.4 percent), Davao Region (3.2 percent), and Northern Mindanao (1.2 percent). NCR and the said six regions combined accounted for 95.9 percent of total housing loans granted by banks (Figure 6).
The RREPI is a measure of the average change in the prices of various types of housing units, i.e., single detached/attached houses, duplexes, townhouses, and condominium units, based on banks’ data on actual mortgage loans granted to acquire new housing units only. It is a chain-linked index, which is computed using the average appraised value per square meter, weighted by the share of floor area of each type of housing unit to the total floor area of all housing units. The RREPI is used as an indicator for assessing the real estate and credit market conditions in the country. The BSP has been releasing the report since Q1 2016.
Data for the RREPI are obtained through BSP Circular No. 892 dated 16 November 2015, which requires all universal/ commercial banks (UBs/KBs) and thrift banks (TBs) in the Philippines to submit to the BSP a quarterly report on all RRELs granted.
[1] Despite rising Covid cases in Q2 2020, the RREPI peaked at 152.8 in the said quarter, rising by 26.6 percent YoY. This was due to the significant decrease in the proportion or the weight of properties valued at less than Php100,000 per sqm amid the pandemic, which consequently resulted in an increase in the proportion of properties valued at Php100,000 or more per sqm and led to substantial increase in the level of the RREPI during the said period. Loan applications for properties valued at less than Php100,000 per sqm declined by 70 percent in Q2 2020.
[2] Similarly, it may be noted that the housing rent inflation rate was lower at 1.7 percent YoY and 0.1 percent QoQ in Q2 2021 from 1.9 percent and 0.4 percent, respectively in Q1 2021. Source: Philippine Statistics Authority (PSA)
[3] The RREPI is constructed using bank data on actual mortgage loans that are granted within a given period and reported to the BSP. As such, if no loans were granted and reported for a certain type of residential property within the reference period, the price relative will be undefined. Thus, the index level and price change of the pertinent residential property type for the current quarter will be the same as the previous quarter’s index level and price change.


