BACOLOD CITY — Inflation rates in both Negros Occidental and Bacolod City continued to decrease in September 2024, offering relief to consumers as prices of basic goods and services stabilized.
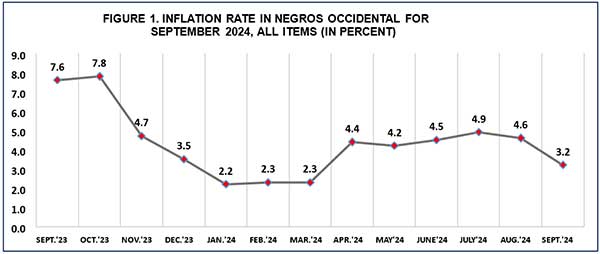
According to the latest data from the Philippine Statistics Authority (PSA), inflation in Negros Occidental dropped to 3.2% in September, down from 4.6% in August.
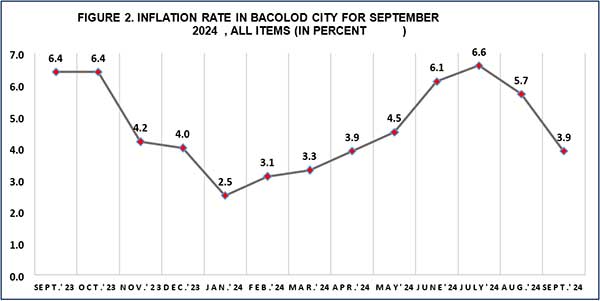
Bacolod City experienced a similar decline, with inflation falling to 3.9%, a decrease from 5.7% the previous month.
This decline in inflation reflects a broader national trend, with the country’s inflation rate also easing to 1.9% in September from 3.3% in August, showing a consistent slowdown in price increases across many regions.
Factors Contributing to Inflation Decline
The lower inflation rates were driven by price decreases across various commodities.
In Negros Occidental, essential categories such as Food and Non-Alcoholic Beverages, Housing, Water, Electricity, Gas, and Other Fuels showed a decline in their year-on-year price increases.
A similar trend was observed in Bacolod City, where categories like Health, Transport, and Personal Care and Miscellaneous Goods and Services also posted lower inflation figures.
Clothing and Footwear Bucks the Trend
However, not all categories experienced a decrease in inflation.
Clothing and Footwear recorded slight increases in both Negros Occidental and Bacolod City, as did Recreation, Sports, and Culture in Bacolod.
These categories continue to see price growth despite the general decline in inflation.
Historical Trends
The September inflation rates also reflect a significant improvement from the high levels seen in 2023, when Negros Occidental’s inflation stood at 7.6%, and Bacolod City’s inflation was 6.4%. The drop in inflation since then highlights the effects of national and regional economic policies aimed at curbing price hikes amid global economic pressures.
In a year-to-date comparison, Negros Occidental’s inflation rate averages 3.6%, while Bacolod City’s sits slightly higher at 4.4%.
Both areas are performing better than last year, when inflation averaged over 7% in the same period.
Table 2. Year-on-Year Inflation Rates of the CPI for All Income Households in Negros Occidental and Bacolod City, January 2021 to September 2024.
| Month | 2021 | 2022 | 2023 | 2024 | ||||
| Bacolod City | Neg Occ | Bacolod City | Neg Occ | Bacolod City | Neg Occ | Bacolod City | Neg
Occ |
|
| January | 3.0 | 4.1 | 3.9 | 7.6 | 12.1 | 12.2 | 2.5 | 2.2 |
| February | 4.4 | 5.8 | 3.5 | 6.3 | 11.2 | 12.4 | 3.1 | 2.3 |
| March | 5.5 | 6.4 | 4.3 | 7.3 | 8.7 | 10.8 | 3.3 | 2.3 |
| April | 4.3 | 4.5 | 4.6 | 7.7 | 8.7 | 8.8 | 3.9 | 4.4 |
| May | 5.1 | 5.2 | 4.8 | 8.2 | 7.5 | 8.3 | 4.5 | 4.2 |
| June | 5.1 | 5.1 | 5.1 | 8.2 | 6.7 | 8.1 | 6.1 | 4.5 |
| July | 5.0 | 4.6 | 4.2 | 8.4 | 6.6 | 7.6 | 6.6 | 4.9 |
| August | 4.8 | 5.3 | 6.3 | 8.0 | 5.7 | 7.9 | 5.7 | 4.6 |
| September | 3.2 | 5.3 | 6.8 | 7.8 | 6.4 | 7.6 | 3.9 | 3.2 |
| October | 5.5 | 7.0 | 5.7 | 6.9 | 6.4 | 7.8 | ||
| November | 4.7 | 6.1 | 8.7 | 11.1 | 4.2 | 4.7 | ||
| December | 4.2 | 5.9 | 9.7 | 12.3 | 4.0 | 3.5 | ||

