Residential real estate prices for various types of new housing units in the Philippines declined in Q3 2024.
Residential property prices fell by 2.3 percent year-on-year (y-o-y)—the first contraction since Q3 2021. On a quarter-on-quarter (q-o-q) basis, housing prices also reverted into the negative territory at 1.6 percent, after two consecutive quarters of positive growth (Figure 1).

By area, residential property prices decline y-o-y in the National Capital Region (NCR), but increase in Areas Outside the NCR (AONCR)
On a y-o-y basis, residential property prices in the National Capital Region (NCR) further decreased by 14.6 percent in Q3 2024. This decline was driven by the decrease in prices of duplex housing units, single-detached/attached houses, and condominium units, which offset the increase in townhouse prices (Figures 1 and 2a).

By contrast, residential property prices in Areas Outside the NCR (AONCR) increased by 3.0 percent. Higher house prices in AONCR were attributed to the annual price increases in single-detached/attached houses and condominium units, which outweighed the decline in duplex housing units and townhouse prices (Figures 1 and 2b).

On a q-o-q basis, residential property prices in the NCR and AONCR fell by 3.7 percent and 1.0 percent, respectively (Figure 1).
By housing type, y-o-y change in residential property prices show mixed trends
By housing type, prices of duplex housing units and condominium units decreased by 48.1 percent and 9.4 percent y-o-y in Q3 2024, respectively. Meanwhile, prices of single-detached/attached houses and townhouses grew by 2.9 percent and 0.7 percent y-o-y, respectively (Figure 2c).[1]

On a q-o-q basis, only single-detached/attached houses registered a price increase (at 2.6 percent), while other housing types, i.e., duplex housing units (at 46.6 percent), townhouses (at 5.3 percent), and condominium units (at 5.3 percent), recorded a decline in prices (Figure 2c).
Nationwide loan availments for new housing units decline y-o-y, but increase q-o-q
In Q3 2024, the number of residential real estate loans (RRELs) granted for all types of new housing units in the Philippines contracted by 15.7 percent y-o-y. Specifically, loans granted in the NCR and AONCR decreased by 20.3 percent and 13.0 percent, respectively (Figure 3a). Notably, the double-digit y-o-y contraction in RRELs in the Philippines, NCR, and AONCR in Q3 2024 was significant, yet not as severe as the decline in housing loan availment observed during the pandemic, which began in Q2 2020. This is also consistent with the outcome of the Q3 2024 Consumer Expectations Survey (CES), which showed consumers’ more pessimistic view on buying a house and lot during the period.[2]
On a q-o-q basis, nationwide housing loan availments grew by 3.1 percent as the 15.8-percent increase in the NCR negated the 2.4-percent contraction in AONCR (Figure 3a). This confirms the results of the Q3 2024 Senior Bank Loan Officers’ Survey (SLOS), indicating a higher net increase in household loan demand for housing compared with the previous quarter.[3],[4]

The number of RRELs granted for new single-detached/attached houses in the Philippines contracted by 24.5 percent y-o-y as the loans granted in the NCR and AONCR decreased by 41.2 percent and 23.7 percent, respectively. Similarly, nationwide loan availments for new single-detached/attached houses fell by 5.5 percent q-o-q driven by the 31.0-percent and 4.2-percent decreases in the NCR and AONCR, respectively (Figure 3b).

For new duplex housing units in the Philippines, the number of RRELs granted declined by 76.7 percent and 52.4 percent from year-ago and quarter-ago levels in Q3 2024. Specifically, the NCR posted a decline of 83.3 percent y-o-y, while AONCR registered contractions of 75.7 percent y-o-y and 57.1 percent q-o-q (Figure 3c).[5]

In Q3 2024, the number of RRELs granted for new townhouses in the Philippines declined marginally by 0.7 percent y-o-y due to the 1.4-percent and 0.6-percent contraction in the NCR and AONCR, respectively. On a q-o-q basis, loan availments for new townhouses decreased by 9.6 percent as those in the NCR and AONCR decreased by 3.3 percent and 10.3 percent, respectively (Figure 3d).

The number of RRELs granted for new condominium units in the Philippines fell by 13.2 percent y-o-y in Q3 2024 as the 20.0-percent decrease in the NCR outweighed the 6.5-percent increase in AONCR. On a q-o-q basis, loan availments for new condominium units recovered by 19.5 percent, resulting from the combined growth posted in the NCR (at 20.6 percent) and AONCR (at 17.3 percent) (Figure 3e).

In Q3 2024, the appraised value of new housing units in the country averaged Php86,417 per square meter (sqm), registering a 6.2-percent decline and 3.2-percent growth over comparable year-ago and quarter-ago levels, respectively. Meanwhile, the average appraised value per sqm in the NCR decreased by 13.7 percent y-o-y and 3.6 percent q-o-q to Php135,076 per sqm. By contrast, the average appraised value per sqm in AONCR expanded by 10.1 percent y-o-y and 3.5 percent q-o-q to Php60,804. It may be noted that the average appraised value of properties in the NCR is more than twice that in AONCR (Figure 4).

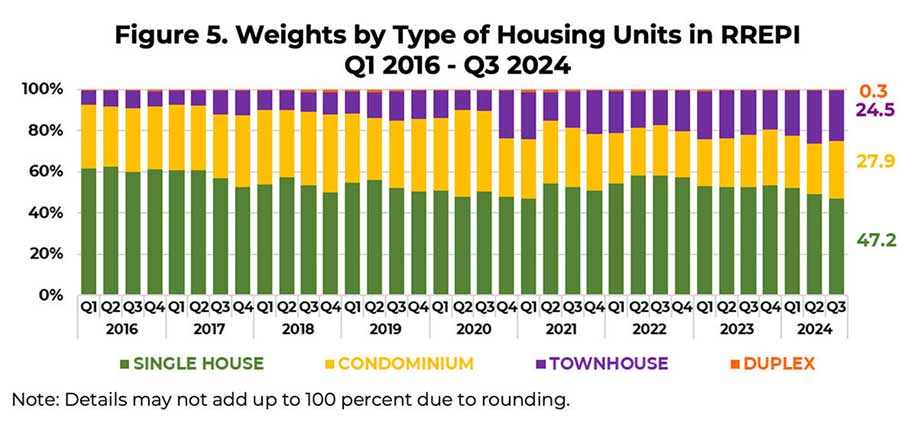
The weight of each type of housing unit in the RREPI is calculated by dividing the total floor area (in sqm) of a specific type of housing unit by the total floor area of all housing types.[6] In Q3 2024, single-detached/attached houses continued to constitute the largest weight in the RREPI at 47.2 percent. Meanwhile, condominium units, townhouses, and duplex housing units accounted for 27.9 percent, 24.5 percent, and 0.3 percent in the calculation of the RREPI, respectively (Figure 5).

The RREPI is a measure of the average change in the prices of various types of housing units, i.e., single-detached/attached houses, duplex housing units, townhouses, and condominium units, based on banks’ data on actual mortgage loans granted to acquire new housing units (excluding pre-owned or foreclosed properties). It is a chain-linked index, which is computed using the average appraised value per square meter, weighted by the share of floor area of each type of housing unit to the total floor area of all housing units. The RREPI is used as an indicator for assessing the real estate and credit market conditions in the country. The BSP has been releasing the report since June 2016.
Data for the RREPI are obtained through BSP Circular No. 892 dated 16 November 2015, which requires all universal/commercial banks (UBs/KBs) and thrift banks (TBs) in the Philippines to submit to the BSP a quarterly report on all RRELs granted. This was supplemented by the BSP Circular No. 1154 dated 14 September 2022, which requires all digital banks (DBs) in the country to submit similar reports to the BSP.
[1] Despite duplex housing units registering the lowest y-o-y and q-o-q growth rates among housing types, the corresponding number of loan transactions granted was relatively low, accounting for only 0.15 percent of the 6,626 total number of new housing units sold in Q3 2024. The majority of duplex loan transactions were for low-value properties, which pulled the average price downwards. Specifically, 90 percent of the duplex units purchased through bank loans were appraised below the 3-year average of Php40,941 per sqm.
[2] The confidence index (CI) on buying a house and lot turned more negative at -58.1 percent in Q3 2024 from -49.9 percent in Q3 2023.
[3] The diffusion index (DI) for housing loan demand of households increased to 33.3 in Q3 2024 from 23.5 in Q2 2024. Meanwhile, the DI for the banks’ credit standards for housing loans extended to households was lower at -6.1 in Q3 2024 from -2.9 in Q2 2024.
[4] Accounting for all transactions for new, pre-owned, and foreclosed housing units, the total number of RRELs granted in the Philippines decreased by 15.1 percent y-o-y, reflecting the 19.2 percent and 13.2 percent decline in both the NCR and AONCR, respectively. By contrast, the total number of transactions increased by 7.3 percent q-o-q, owing to the 9.3-percent and 6.4-percent growth in the number of RRELs in the NCR and AONCR, respectively.
[5] For duplex housing units, no q-o-q RREL growth was computed for the NCR in Q3 2024 due to the lack of transactions in Q2 2024.
[6] The weight is computed using loan transactions on new housing units only.


