


Residential real estate prices of various types of new housing units in the Philippines continued to increase in Q4 2023, rising by 6.5 percent year-on-year (YoY), albeit lower than the 12.9 percent growth in Q3 2023.
Quarter-on-quarter (QoQ), the index contracted by 3.6 percent, which is a reversal of the 3.4 percent growth registered in Q3 2023 (Figure 1).
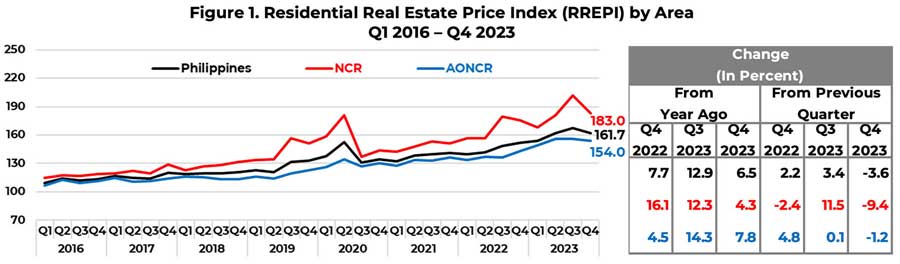
By area, residential property prices increase YoY in both the NCR and AONCR
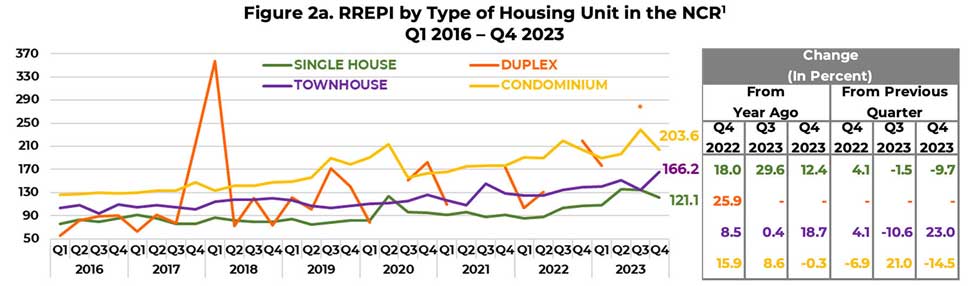
On a YoY basis, residential property prices in the National Capital Region (NCR) rose by 4.3 percent in Q4 2023 as the growth in the prices of single-detached/attached houses and townhouses outweighed the decline in the prices of condominium units (Figures 1 and 2a).
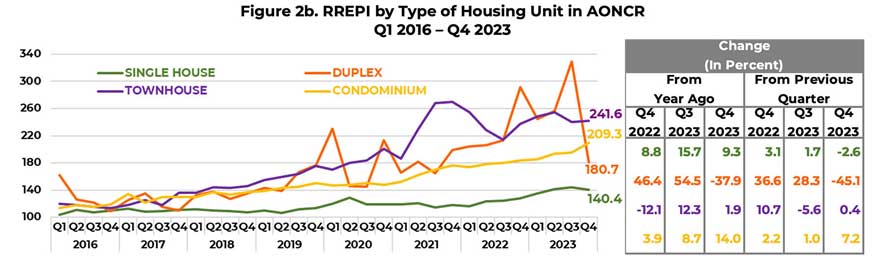
Similarly, residential property prices in Areas Outside the NCR (AONCR) grew by 7.8 percent, driven by annual increases in the prices of all types of housing units, except for duplex housing units where growth contracted (Figures 1 and 2b).
On a QoQ basis, residential property prices declined by 9.4 percent and 1.2 percent in the NCR and AONCR, respectively (Figure 1).
Prices rise across all housing types, except duplex
By housing type, prices of single-detached/attached houses registered the highest YoY growth rate in Q4 2023 (at 9.5 percent), followed by townhouses (at 4.9 percent), and condominium units (at 4.1 percent). Meanwhile, prices of duplex housing units decreased by 33.5 percent (Figure 2c).
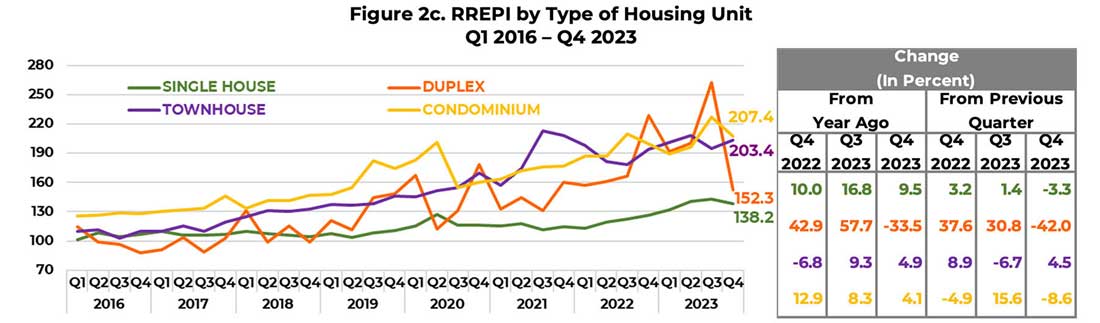
On a QoQ basis, trends by housing type reversed as only townhouses recorded a price increase in Q4 2023 (at 4.5 percent) compared with the Q3 2023 results wherein only townhouses registered a price decrease (at -6.7 percent). In Q4 2023, prices of duplex housing units declined the fastest (by 42 percent), followed by condominium units (by 8.6 percent), and single-detached/attached houses (by 3.3 percent) (Figure 2c).
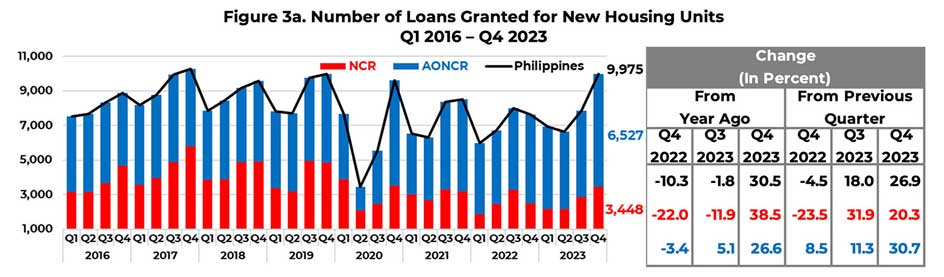
Nationwide loan availments for new housing units grow at double-digit YoY and QoQ rates
In Q4 2023, the number of residential real estate loans (RRELs) granted for all types of new housing units in the Philippines grew by 30.5 percent YoY, with those from the NCR and AONCR rising by 38.5 percent and 26.6 percent, respectively. Likewise, nationwide housing loan availments continued to grow by 26.9 percent QoQ, following the 20.3 percent and 30.7 percent increase in the number of RRELs in the NCR and AONCR, respectively (Figure 3a).
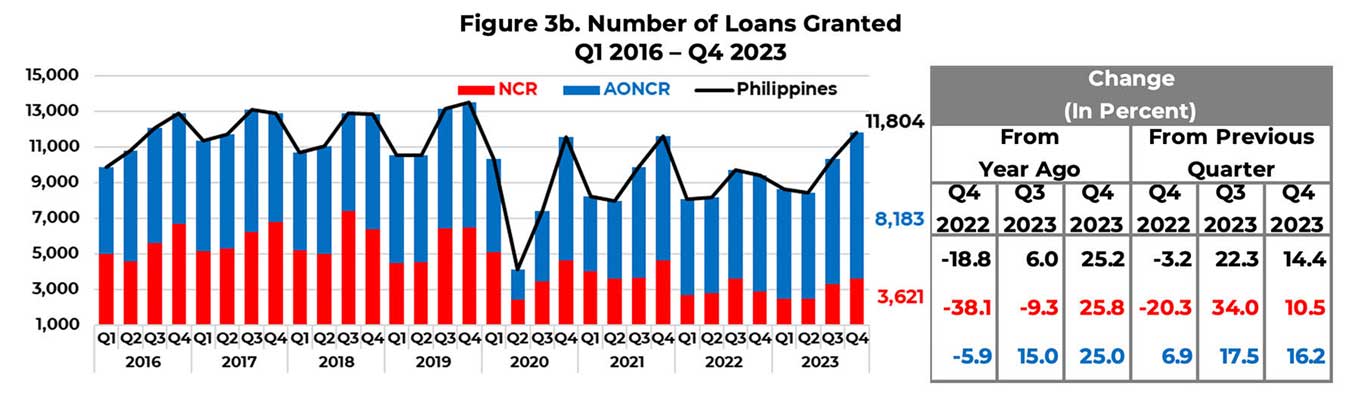
The total number of RRELs granted in the Philippines rose by 25.2 percent, with the pace of growth almost the same in the NCR (at 25.8 percent) and AONCR (at 25 percent). Meanwhile, the total number of transactions grew by 14.4 percent QoQ, brought about by the 10.5 percent and 16.2 percent increase in the number of RRELs in the NCR and AONCR, respectively (Figure 3b).
In Q4 2023, the appraised value of new housing units in the country averaged to Php89,042 per square meter (sqm), registering a 19.1 percent growth over the comparable year-ago level as opposed to the 3.4 percent contraction from the quarter-ago level. Similarly, the average appraised value per sqm in the NCR increased by 5.5 percent YoY but declined by 14.3 percent QoQ to Php134,178 per sqm. Meanwhile, in AONCR, the average appraised value per sqm expanded by 31.8 percent YoY and 18.1 percent QoQ to Php65,186. It may be noted that the average appraised value of properties in the NCR is double that of AONCR (Figure 4).

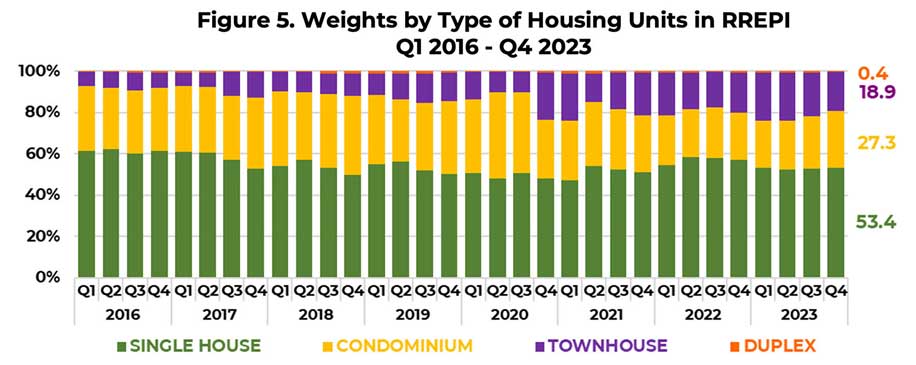
The weight of each type of housing unit in the RREPI is determined by dividing the total floor area (in sqm) of a specific type of housing unit over the total floor area of all housing types.[2] In Q4 2023, single-detached/attached houses continued to constitute the largest weight in the RREPI at 53.4 percent. Meanwhile, condominium units, townhouses, and duplex housing units accounted for 27.3 percent, 18.9 percent, and 0.4 percent in the calculation of the RREPI, respectively (Figure 5).
In Q4 2023, 84.5 percent of residential real estate loan (RRELs) transactions were used to purchase new housing units.[3] Meanwhile, by type of housing unit, most of the residential property loans were used for the acquisition of single-detached/attached houses and condominium units both at 42.6 percent, followed by townhouses (14.7 percent) as seen in Figure 6.
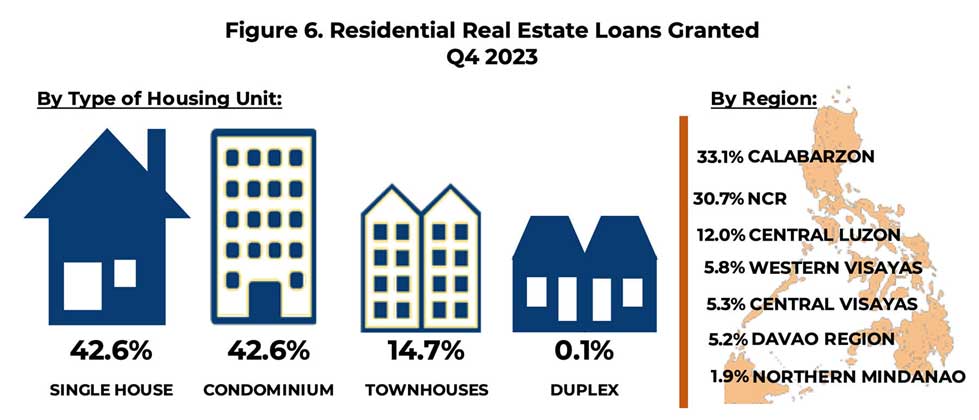
Most of the RRELs granted in the NCR were for the purchase of condominium units, while RRELs granted in AONCR were for the purchase of single-detached/attached houses. By region, 30.7 percent of the total number of RRELs granted were from the NCR. The other regions, which contributed significantly to the number of RRELS granted, were as follows: CALABARZON (33.1 percent), Central Luzon (12 percent), Western Visayas (5.8 percent), Central Visayas (5.3 percent), Davao Region (5.2 percent), and Northern Mindanao Region (1.9 percent). The said regions, including the NCR, comprised 94 percent of the total housing loans granted by banks (Figure 6).
The RREPI is a measure of the average change in the prices of various types of housing units, i.e., single-detached/attached houses, duplex housing units, townhouses, and condominium units, based on banks’ data on actual mortgage loans granted to acquire new housing units (excluding pre-owned or foreclosed properties). It is a chain-linked index, which is computed using the average appraised value per square meter, weighted by the share of floor area of each type of housing unit to the total floor area of all housing units. The RREPI is used as an indicator for assessing the real estate and credit market conditions in the country. The BSP has been releasing the report since June 2016.
Data for the RREPI are obtained through BSP Circular No. 892 dated 16 November 2015, which requires all universal/commercial banks (UBs/KBs) and thrift banks (TBs) in the Philippines to submit to the BSP a quarterly report on all RRELs granted. This was supplemented by the BSP Circular No. 1154 dated 14 September 2022, which requires all digital banks (DBs) in the country to submit similar reports to the BSP.
[1] No index was generated for periods without bank loan transactions for duplex housing units in the NCR, as reflected by gaps in the series (orange line).
[2] The weight is computed using loan transactions on new housing units only.
[3] On the remaining residential housing properties purchased using RRELs in Q4 2023, 15.1 percent were pre-owned, while 0.4 percent were foreclosed properties.


